
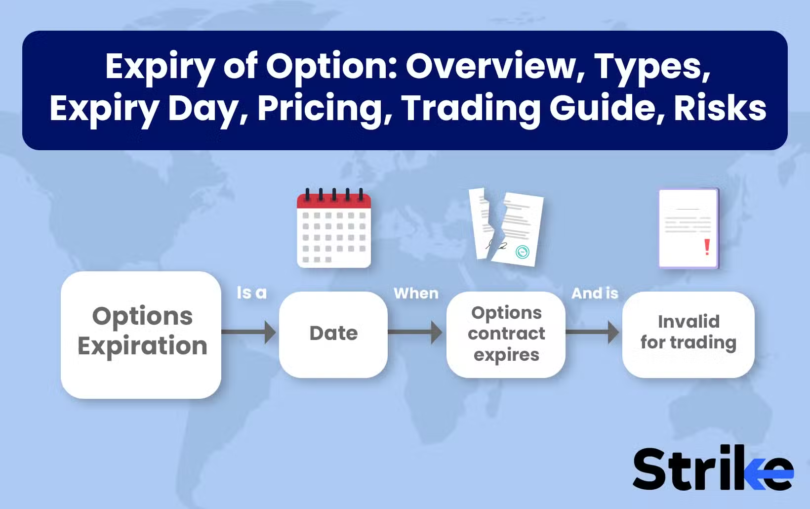

One of the most attentively watched sessions in the derivatives market is the expiry day. This is the day when option contracts expire, which results in increased trading volume and often large price swings.
Traders tend to look at movements in option premiums, open interest and strike-wise position changes to gauge the sentiment of the market. Expiry day can be evidently volatile, but it can also be an indicator of the direction that the market may take. In this blog, let us explore how expiry day options activity can be observed to understand the market direction.
What makes expiry day different?
This is the day when option contracts expire, so traders need to close their positions, roll over to the next expiry or let them expire. This means that the volume of trades and volatility levels may rise. According to their market expectations, both institutional and retail participants adjust their positions actively.
Adjustments as such can bring about sudden price fluctuations within a short time. That is why expiry day trading can appear to be more aggressive than a normal trading session. These movements can help traders understand the market sentiment when observing the Sensex expiry day.
Key options data to watch on expiry day
Here is what you should track.
Open interest (OI)
Open interest is the total number of option contracts outstanding and not settled yet. A high level of open interest at a strike price can signify a significant support or resistance level. For instance, the strike with high put open interest might serve as support, and the strike with high call open interest might serve as resistance.
Put-call ratio (PCR)
The put-call ratio is the ratio of the number of put options to the number of call options in the market. A higher PCR could signal greater bullish expectations, while a lower PCR might signify a rise in bearish sentiment. Nevertheless, it is advisable not to interpret PCR alone. Sometimes, extreme readings may indicate a possible reversal.
Option writing activity
Sometimes, an option writer can give valuable clues to market expectations. If there is strong call writing on a given strike, it could signal resistance at that price. Likewise, heavy put writing can indicate that traders are confident the market will stay above a specific price point, forming a support zone.
Changes in premiums
Faster changes in option premiums may signal changing expectations. Increasing premiums can be a sign of growing demand or uncertainty, whereas declining premiums can be a sign of a decrease in conviction. By tracking the movement of premiums and open interest, one can gain a better understanding of market sentiment.
How to interpret market direction using options activity
Expiry day option chain reading can be made more effective by studying multiple indicators together.
For example, heavy put writing combined with an escalating index is considered a bullish indicator. Conversely, a strong call writing coupled with a weak index may signal bearish sentiment.
In call options, short coverings can be a bullish indication as traders are exiting bear positions. Likewise, unwinding of put positions can indicate that the support levels are softening.
Rather than relying on a single indicator, traders should evaluate open interest, PCR, option writing activity, and price action together to form a more balanced view.
Traders should always use multiple indicators, such as open interest, PCR, option writing activity and price action collectively for a well-balanced perspective.
Bottom line
One can garner valuable insights into market sentiment and potential price direction through expiry day options activity. Option writing, PCR, open interest and premium changes can be useful to see how market participants are positioning themselves.
Nevertheless, one should not use options data alone. When paired with other market analysis tools, these indicators can help traders make more well-informed choices and prevent making judgments based on a single data point.