In 2023/24, several Premier League clubs consistently created enough chances to score more than they actually did, producing a clear gap between their expected goals and real goal totals. For data‑minded observers, these sides are prime candidates to discuss in terms of “form rebound”, because their underlying attacking process looked stronger than the headline results. The key question is not just who underperformed xG, but under what conditions that gap is likely to close rather than persist.
Why High xG with Low Goals Suggests Potential Rebound
Expected goals aggregate the probability of each shot becoming a goal, so over a long sample they approximate what an average finishing team would score from the same chances. When a club’s total xG over a season clearly exceeds its goal tally, the cause is systematic underperformance in finishing—through poor shooting, decision-making, or variance—rather than a lack of opportunity. The immediate outcome is a points return below what their chance creation might merit, and the longer‑term impact can be either an eventual correction or an entrenched efficiency problem.
From a “rebound” perspective, xG underperformance tells you that the team’s attack is not fundamentally broken in terms of creating looks; instead, something in conversion is lagging behind. If that lag is driven mostly by short‑term randomness, the expectation is that future results will drift back toward the xG baseline. If the lag reflects structural issues—limited striker quality, poor shot profiles, or chronic confidence problems—the gap can stay open far longer than simple models assume.
Which 2023/24 Teams Had xG Higher Than Their Goals?
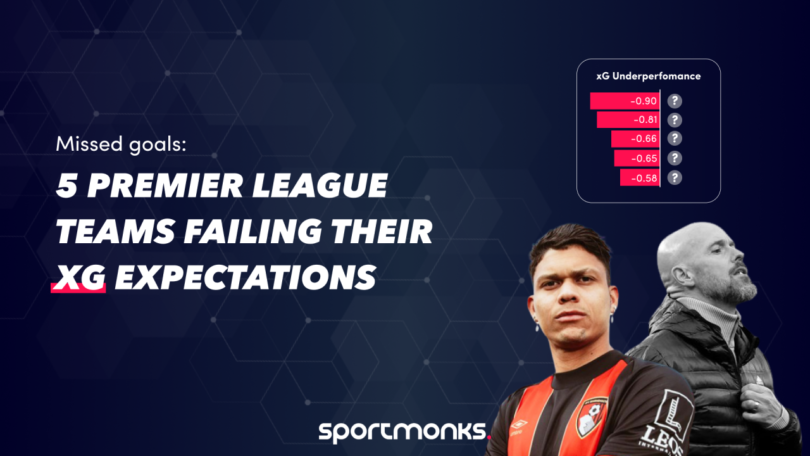
Team‑level xG underperformance tables for 2023/24 show a group of clubs whose xG exceeded their goals to varying degrees. Data summarised for that season lists Arsenal, Brentford, Bournemouth, Burnley, Chelsea, Crystal Palace and Everton among those with notable attacking xG totals, and in several of these cases the goals scored figure sat below the chances generated. Complementary analysis of the xG-based league table notes that Chelsea and Newcastle “impressed on the xG front” yet were “incredibly inefficient in front of goal”, while Everton’s wastefulness was described as the most severe.
Premier League 2023/24 – High xG, Lower Goal Output (Illustrative Snapshot)
| Club | xG (2023/24) | Goals scored (G) | Basic reading of xG vs goals |
| Brentford | 57.47 | 54 | Modest underperformance in conversion |
| Bournemouth | 59.26 | 56 | Slight lag behind chance quality |
| Chelsea | 75.97 | 77 | Output close to xG, but inefficient phases flagged in analysis |
| Crystal Palace | 49.37 | 57 | Actually outperformed xG overall, despite some underperforming stretches |
| Everton | 56.71 | 40 | Heavy underperformance, major gap |
| Burnley | 41.25 | 41 | Output roughly in line with xG |
Beyond this raw table, narrative pieces singled out Everton as “leading the way” in xG underperformance, while Chelsea and Newcastle were grouped as notable underachievers relative to their expected attacking numbers, even when totals looked respectable. This combination of numeric evidence and contextual analysis helps identify where the “high xG, low goals” story was strongest in 2023/24.
Mechanisms: How xG Gaps Turn into Rebound Candidates
The mechanics behind an xG–goals gap determine whether a future rebound is plausible. If a team’s xG comes from repeated shots in central areas, one‑on‑ones and cutbacks, then repeated underperformance suggests that either specific finishers are below par or that a cluster of near‑misses has dragged numbers down temporarily. For instance, player‑level data highlighted Dominic Calvert‑Lewin, Darwin Núñez and Nicolas Jackson as forwards scoring several goals fewer than expected, which directly fed underperformance at club level.
In those situations, replacing or improving these key finishers can drive a rebound if the chance creation remains stable. By contrast, if xG comes heavily from set‑pieces or low‑angle efforts, the theoretical “deserved” total may be less repeatable, because slight tactical shifts or opposition adjustments can alter the volume and quality of those chances. Teams whose structure relies on chaotic transitions rather than controlled patterns also face more volatility, making their xG underperformance harder to treat as a guaranteed future windfall.
Value-Based Betting Angle: Turning xG Underperformance into Opportunity
Among the available perspectives, this topic aligns most directly with value-based betting, where the aim is to spot mismatches between a team’s true level and the market’s pricing. If bookmakers and casual bettors anchor heavily on recent goals and results, an xG‑strong but goal‑poor club may be underrated in win, over/under or goals‑line markets. The cause is simple: public focus on outcomes rather than process, the outcome is mispricing, and the potential impact is a pocket of value until expectations adjust.
However, value emerges only when xG underperformance is likely to correct and odds do not already reflect that likelihood. A simple working sequence for these teams might be:
- Verify sustained xG > goals over a meaningful sample (not just a few games).
- Check whether finishing issues stem from specific players identified as major underperformers.
- Assess whether personnel changes, tactical tweaks or confidence shifts are in place to support improvement.
- Compare your expectation of future goals to the goal‑related markets on offer to see if any price still assumes the old “inefficient” profile.
Only when these steps line up does “waiting for the rebound” become a structured value idea, rather than a vague hope that “they’re due”.
Reading xG Stories Through a Betting Platform (UFABET)
The way xG information is presented can strongly influence how rationally it is used, especially when it appears inside integrated online environments with many simultaneous stimuli. When a bettor enters a structured digital platform such as the one offered by ufa168 เบอร์โทร, they often see xG‑based tables, “deserved goals” headlines and graphics about underperforming forwards positioned next to match odds and goal lines; in that setting, the danger is that a team labelled as “xG underperformer” in 2023/24 is automatically treated as a rebound lock, even if the underlying causes—misfiring strikers, tactical shifts, or tougher upcoming fixtures—make any short‑term correction uncertain, so the disciplined approach is to treat those xG gaps as raw input that must be cross‑checked against context, not as standalone signals.
Situations Where Waiting for a Rebound Makes Sense
There are identifiable conditions under which betting on an xG‑strong, goal‑weak team to improve becomes more reasonable. One is where individual underperformance is concentrated in a small number of high‑usage attackers—Calvert‑Lewin or Jackson‑type cases—who either have stronger historical records or clear technical upside, suggesting that their current finishing slump is unsustainably bad. Another is when a side continues to post high xG in recent matches despite poor scorelines, indicating that the underlying process remains intact.
Fixture difficulty and schedule also matter. If an xG‑strong team has just endured a run of elite opponents and is about to face weaker defences, the environment becomes more favourable for a rebound. Conversely, if underperformance coincides with a period of mounting injuries or a tactical shift that slightly reduces shot quality, the case for an imminent bounce weakens even if the season-long xG gap still looks large. In short, genuine rebound spots appear where process persists and conditions ease, not simply where a spreadsheet shows a negative xG delta.
Conditions Where the xG–Goal Gap Stays Open
There are also clear failure cases where waiting for form to “correct” becomes a trap. Clubs with limited budgets or constrained recruitment may not have access to better finishers, meaning that a pattern of underperformance persists across multiple seasons despite decent chance creation. In these cases, xG underperformance is not just bad luck but a reflection of structural quality gaps in attacking personnel.
Another failure case arises when xG inflates through volume rather than quality; frequent low‑value shots can generate moderate xG without producing many real scoring threats, especially if players shoot from slightly better positions than the model considers but with poor technique. If a manager responds to poor finishing by tightening up instead of doubling down on attacking freedom, future xG may fall at the same time as goals do, closing the gap without delivering the rebound bettors hoped for. This is why blindly trusting large negative xG differentials can be dangerous when the tactical environment is unstable.
Comparing Key Underperformers: Everton, Brentford and Chelsea
How different xG stories shape rebound expectations
Even among xG‑underperforming clubs, context changes how attractive any “rebound” thesis looks. Everton’s 56.71 xG and only 40 goals highlight a severe conversion problem, heavily driven by forwards identified as major individual underperformers; here, any improvement in finishing, recruitment, or set‑piece efficiency could unlock a sharp swing in results if the chance creation holds. Brentford’s 57.47 xG and 54 goals point to a smaller, more manageable gap, which may narrow naturally without dramatic overcorrection.
Chelsea’s case combines high total xG with periods of inefficiency and youth‑heavy attacking units still learning, making them a candidate where improvement could arrive through development rather than wholesale change. For each of these sides, the rebound question is not “will goals go up?” but “how fast, how far, and is the market already pricing that expectation in?”. Comparing them across xG size, xG–goal gap, and squad trajectory helps determine where waiting for better finishing is justified and where it remains speculative.
casino online Context: How Digital Environments Shape xG Narratives
In broader gambling ecosystems, xG graphics and “deserved results” talk often sit side by side with quick‑resolution games and non‑football options, which influences how users emotionally process those statistics. When a bettor moves between instant games and match markets within a casino online website, there is a risk that negative xG differentials are treated almost as sure‑thing correction signals instead of as nuanced indicators tied to squad quality, tactics and variance; the more thoughtful approach is to slow the pace, re‑examine the 2023/24 xG numbers in detail, and ask whether any specific team’s gap between xG and goals is likely to close for structural reasons, or whether it reflects limitations that may keep results below the model’s expectations for longer than headline narratives suggest.
Summary
In the 2023/24 Premier League, several clubs generated more xG than goals, with Everton, Brentford and Chelsea standing out in both raw numbers and analytical commentary. Their patterns show that high xG with low goals can signal either upcoming improvement or persistent weakness, depending on whether finishing issues stem from short‑term variance or deeper structural constraints. For anyone waiting on a “form rebound”, the only defensible approach is to treat xG–goal gaps as starting points—combined with tactical context, player profiles and market prices—rather than as guarantees that goals will automatically catch up